INTRODUCTION TO POWER BI
Microsoft Power BI is a business intelligence platform that provides non-technical business users with tools for aggregating, analyzing, visualizing, and sharing data. Power BI's user interface is fairly intuitive for users familiar with Excel and its deep integration with other Microsoft products makes it a very versatile self-service tool that requires little upfront training.
A free version of Power BI is intended for small to midsize business owners; a professional version called Power BI Plus is available for a monthly subscription fee. Users can download an application for Windows 10, called Power BI Desktop, and native mobile apps for Windows, Android and iOS devices. There is also Power BI Report Server for companies that must maintain their data and reports on-premises. That version of Power BI requires a special version of the desktop app called Power BI Desktop for Power BI Report Server.
Common uses of Power BI
Microsoft Power BI is used to find insights within an organization's data. Power BI can help connect disparate data sets, transform and clean the data into a data model and create charts or graphs to provide visuals of the data. All of this can be shared with other Power BI users within the organization.
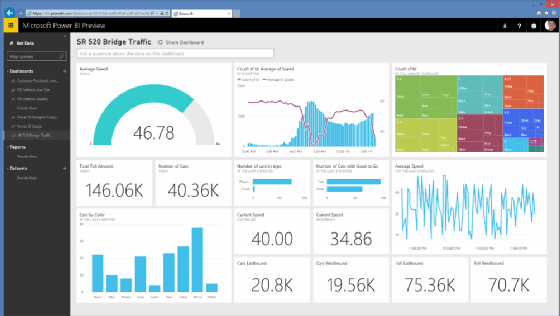
The data models created from Power BI can be used in several ways for organizations, including telling stories through charts and data visualizations and examining "what if" scenarios within the data. Power BI reports can also answer questions in real-time and help with forecasting to make sure departments meet business metrics.
Power BI can also provide executive dashboards for administrators or managers, giving management more insight into how departments are doing.


Comments
Post a Comment